3D charts can easily be created to visualize data in a new way
Introduction
3D charts also have a very simple API. They can be used to plot data that is varying in 3 dimensions; these dimensions are represented by x, y and z. Therefore the 3D series is represented by the XYZ component.
Types of 3D Charts Available
A number of 3D charts are available using the Picta library. The basic charts that can be created setting the type parameter are as follows:
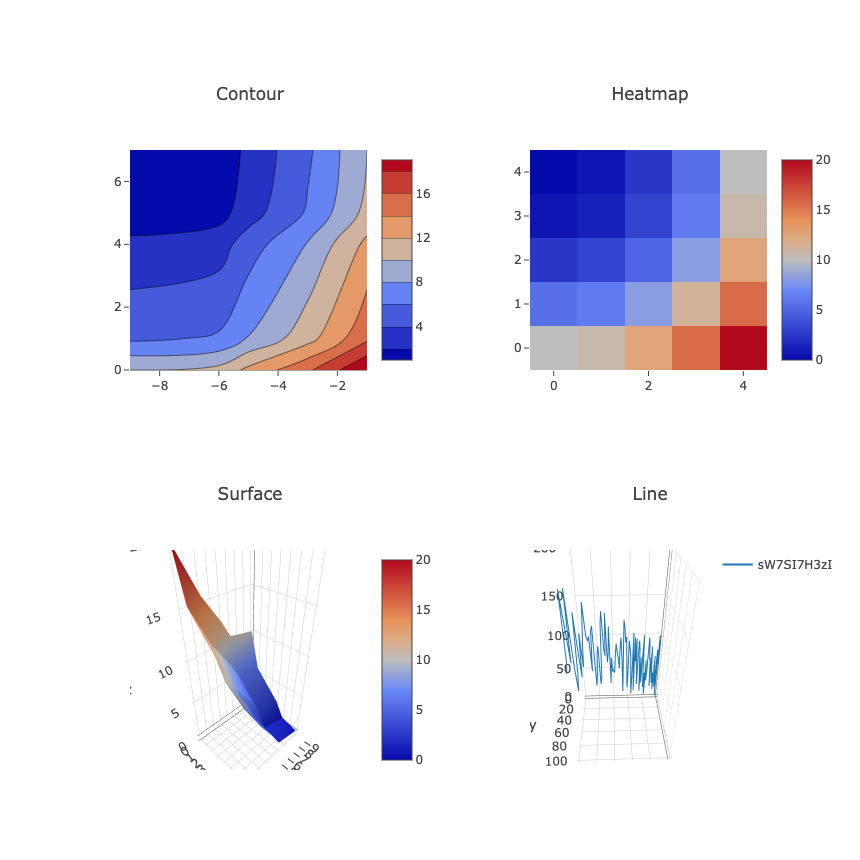
SCATTER3D: This will transform the series to a 3D scatter chart.CONTOUR: This will transform the series to a contour plot.HEATMAP: This transforms the series to a heatmap.SURFACE: This transforms the series to a surface chart.
The next example will demonstrate how to create a Canvas subplot grid with a number of these charts plotted.
Users looking for more specific functionality should consult the API docs.
An Example: Constructing a grid of subplots for 3D charts
import org.carbonateresearch.picta._

import org.carbonateresearch.picta.options._
// lets create some dummy adata for the third dimension
val x = List(-9, -6, -5 , -3, -1)
val y = List(0, 1, 4, 5, 7)
val z = List(
    List(10, 10.625, 12.5, 15.625, 20),
    List(5.625, 6.25, 8.125, 11.25, 15.625),
    List(2.5, 3.125, 5.0, 8.125, 12.5),
    List(0.625, 1.25, 3.125, 6.25, 10.625),
    List(0, 0.625, 2.5, 5.625, 10)
)
// we flatten the nested list as we pass it into the Series constructor
val contour = XYZ(x=x, y=y, z=z.flatten, n=z(0).length).asType(CONTOUR)

// set up the chart
val chart1 = Chart()
            .addSeries(contour)
            .setTitle("Contour")

// plot the chart
chart1.plotInline
// we now flatten the list and pass it into Series constructor, as well as 'n', the length of an element so that the
// heatmap dimensions are correctly constructed
val heatmap = XYZ(z=z.flatten, n=z(0).length) asType HEATMAP

val chart2 = Chart() addSeries heatmap setTitle "Heatmap"

chart2.plotInline
val surface = XYZ(x=x, y=y, z=z.flatten, n=z(0).length) asType SURFACE

val chart3 = Chart() addSeries surface setTitle "Surface" setConfig(false, false)

chart3.plotInline
val x = List.range(1, 100)
val y = List.range(1, 100)
val z = List.range(1, 100).map(e => e + scala.util.Random.nextDouble()*100)

val line = XYZ(x=x, y=y, z=z) asType SCATTER3D drawStyle LINES

val chart4 = Chart() addSeries line setTitle "Line" setConfig(false, false)

chart4.plotInline
val dim = 350

Canvas(2, 2)
.setChart(0, 0, chart1.setDimensions(width = dim, height = dim))
.setChart(0, 1, chart2.setDimensions(width = dim, height = dim))
.setChart(1, 0, chart3.setDimensions(width = dim, height = dim))
.setChart(1, 1, chart4.setDimensions(width = dim, height = dim))
.plotInline
The assembled grid should look like the one below: