The Canvas is the most general component in the Picta library
Introduction
The Canvas component takes care of rendering the charts. It has an underlying grid system which allows multiple, individual charts to be plotted simultaneously; it is therefore composed of multiple charts.
Creating a Canvas
The Canvas constructor takes the following objects:
rows: Number of rows in the Canvas subplot grid.columns: Number of columns in the Canvas subplot grid.title: Title of the Canvas subplot grid.grid: The actual grid containing the chart data.
The Canvas in Action
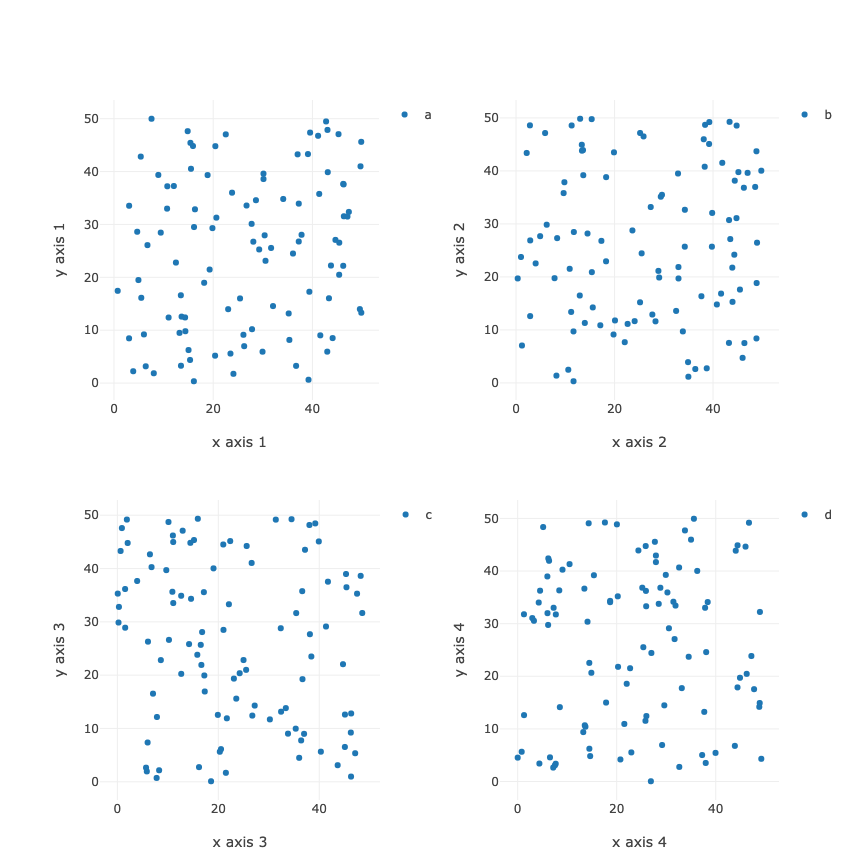
In the following example, the Canvas will be used to plot 4 charts side by side. The code can be used in a Jupyter notebook.
interp.repositories() ++= Seq(coursierapi.MavenRepository.of(
    "https://jitpack.io"
))
import org.carbonateresearch.picta._

import org.carbonateresearch.picta.options._
// create some dummy data
def genRandomSeries() = List.range(0, 100).map(x => scala.util.Random.nextDouble() * 50)

// first define the x-axes we will use in the plot
val ax1 = Axis(X, title = "x axis 1")
val ax2 = Axis(X, title = "x axis 2")
val ax3 = Axis(X, title = "x axis 3")
val ax4 = Axis(X, title = "x axis 4")

// first define the y-axes we will use in the plot
val ax6 = Axis(Y, title = "y axis 1")
val ax7 = Axis(Y, title = "y axis 2")
val ax8 = Axis(Y, title = "y axis 3")
val ax9 = Axis(Y, title = "y axis 4")

// it may be necessary to play around with the chart dimensions and margin  in order to ensure a good fit on screen.
val dim = 350

val chart1 = (
    Chart()
    setDimensions(width = dim, height = dim)
    addSeries (XY(genRandomSeries(), genRandomSeries()).setName("a").drawMarkers)
    addAxes(ax1, ax6)
    setMargin(l=50, r=30, t=50, b=50)
)

val chart2 = (
    Chart()
    setDimensions(width = dim, height = dim)
    addSeries (XY(genRandomSeries(), genRandomSeries()).setName("b").drawMarkers)
    addAxes(ax2, ax7)
    setMargin(l=50, r=30, t=50, b=50)
)

val chart3 = (
    Chart()
    setDimensions(width = dim, height = dim)
    addSeries (XY(genRandomSeries(), genRandomSeries()).setName("c").drawMarkers)
    addAxes(ax3, ax8)
    setMargin(l=50, r=30, t=50, b=50)
)

val chart4 = (
    Chart()
    setDimensions(width = dim, height = dim)
    addSeries (XY(genRandomSeries(), genRandomSeries()).setName("d").drawMarkers)
    addAxes(ax4, ax9)
    setMargin(l=50, r=30, t=50, b=50)
)

// The canvas has an underlying grid. By default the underlying grid is 1x1, but we can pass in the dimensions we
// require by passing in parameters in the constructor.
Canvas(2, 2)
.setChart(0, 0, chart1)
.setChart(0, 1, chart2)
.setChart(1, 0, chart3)
.setChart(1, 1, chart4)
.plotInline
If all has gone correctly, you will see the chart below. As you can see the Canvas allows multiple independent charts to be plotted simultaneously. This is particularly useful for exploratory data analysis.